Dumbell Charts
When to use a dumbell chart
To show the difference between two groups across one variable.
To show the difference between two time periods across one variable.
Style tips
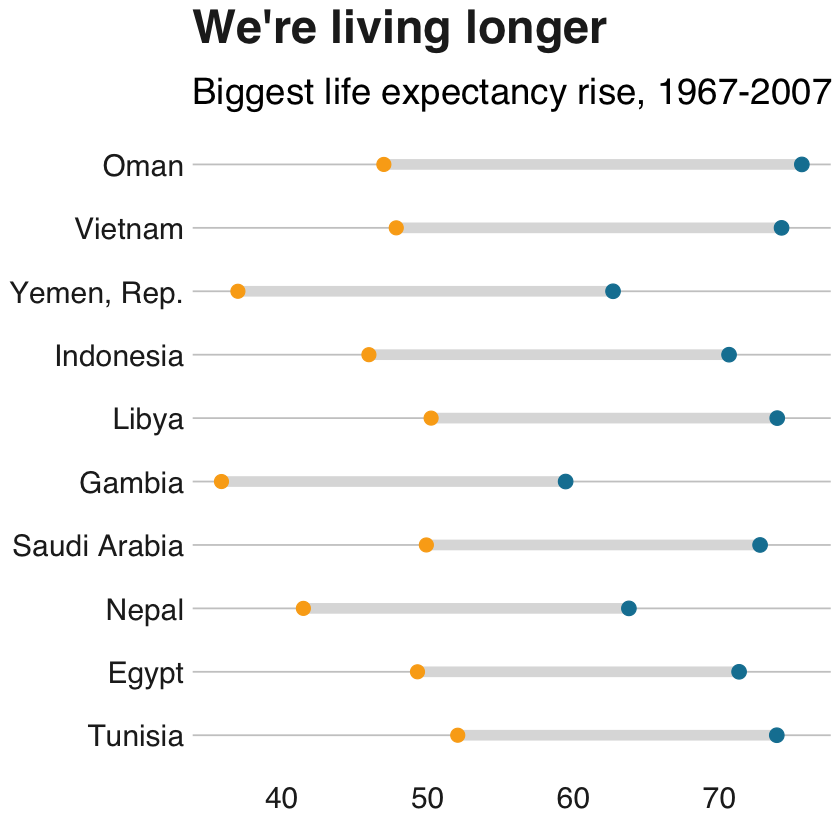
With dumbbell charts you are highlighting two points for each group or time period (the usually cicles) but you’re emphasizing the difference between them (illustrated by the bar or line connecting both circles. Use a lighter color (light gray) or turned the transparency up to emphasize the visual hierarchy.
#This line of code installs the pacman page if you do not have it installed - if you do, it simply loads the package
if(!require(pacman))install.packages("pacman")
devtools::install_github("bbc/bbplot")
pacman::p_load('dplyr', 'tidyr', 'gapminder',
               'ggplot2',  'ggalt',
               'forcats', 'R.utils', 'png',
               'grid', 'ggpubr', 'scales',
               'bbplot')
library("ggalt")
library("tidyr")

#Prepare data
dumbbell_df <- gapminder %>%
  filter(year == 1967 | year == 2007) %>%
  select(country, year, lifeExp) %>%
  spread(year, lifeExp) %>%
  mutate(gap = `2007` - `1967`) %>%
  arrange(desc(gap)) %>%
  head(10)

#Make plot
ggplot(dumbbell_df, aes(x = `1967`, xend = `2007`, y = reorder(country, gap), group = country)) +
  geom_dumbbell(colour = "#dddddd",
                size = 3,
                colour_x = "#FAAB18",
                colour_xend = "#1380A1") +
  bbc_style() +
  labs(title="We're living longer",
       subtitle="Biggest life expectancy rise, 1967-2007")