Tidy data (work in progress)
Warning
Work in progress. This section is still being worked on.
The way you organize your data may depend on the tool you use to analize or visualize said data. One way to do it is the tidy data format created by Hadley Wickham (creator of the tidyverse and many popular R packages). We are highlighting this way to organize data as it is embraced in modern programming languages (like python and R) but also because it is a simple and very powerful way to organize data. Well organized data means you can focus your time on answering analytical questions rather than transforming and manipulating your data.
Tidy data follows three simple rules:
Each variable must have its own column.
Each observation must have its own row.
Each value must have its own cell.
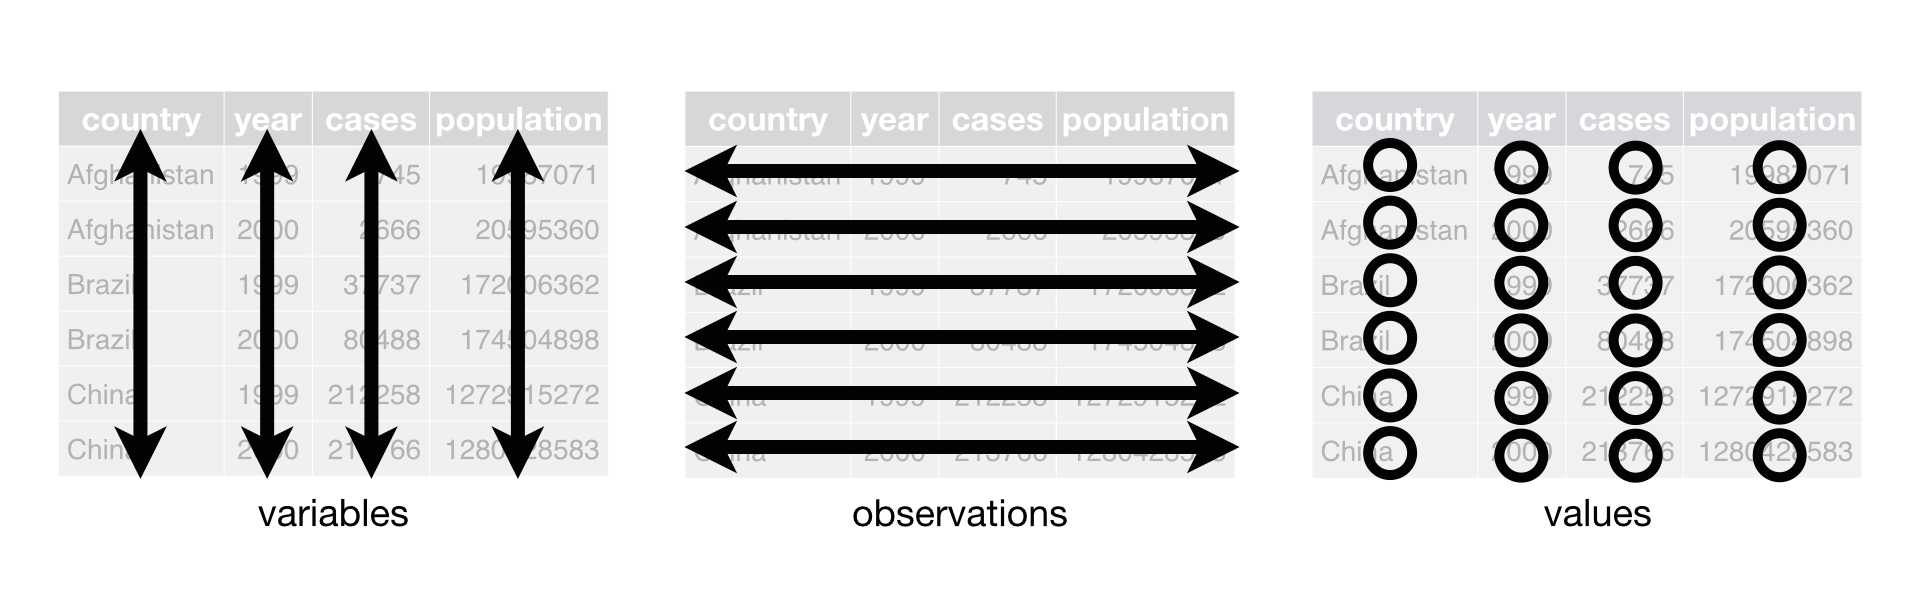
Fig. 3 Tidy data.